

Experiment: Trying out Metabase
Playing around with an alternative to PowerBI and Superset

Disclaimer: I am not paid by metabase or any of its competitors. This is also not a full-blown rigorous review of metabase. I’m just playing around with it out of curiosity.
Metabase is what I would describe as a Business Intelligence (BI) and dashboard building tool that seeks to democratise the use and exploration of data. It is an alternative to well-known tools like PowerBI, Tableau and Superset. I came across it sometime back and decided to take it out for a quick spin, just because…
Getting things up and running
Metabase was pretty simple to get up and running in an local setup using Docker compose. This is provided in their setup instructions. Just use the Docker compose YAML below and you’ll be up and running in less than a minute (depending on your network speed of course). Please note that this is not suited for production/enterprise setup.
version: "3.9"
services:
metabase:
image: metabase/metabase:latest
container_name: metabase
hostname: metabase
volumes:
- /dev/urandom:/dev/random:ro
ports:
- 3000:3000
environment:
MB_DB_TYPE: postgres
MB_DB_DBNAME: metabaseappdb
MB_DB_PORT: 5432
MB_DB_USER: metabase
MB_DB_PASS: mysecretpassword
MB_DB_HOST: postgres
networks:
- metanet1
healthcheck:
test: curl --fail -I http://localhost:3000/api/health || exit 1
interval: 15s
timeout: 5s
retries: 5
postgres:
image: postgres:latest
container_name: postgres
hostname: postgres
environment:
POSTGRES_USER: metabase
POSTGRES_DB: metabaseappdb
POSTGRES_PASSWORD: mysecretpassword
networks:
- metanet1
networks:
metanet1:
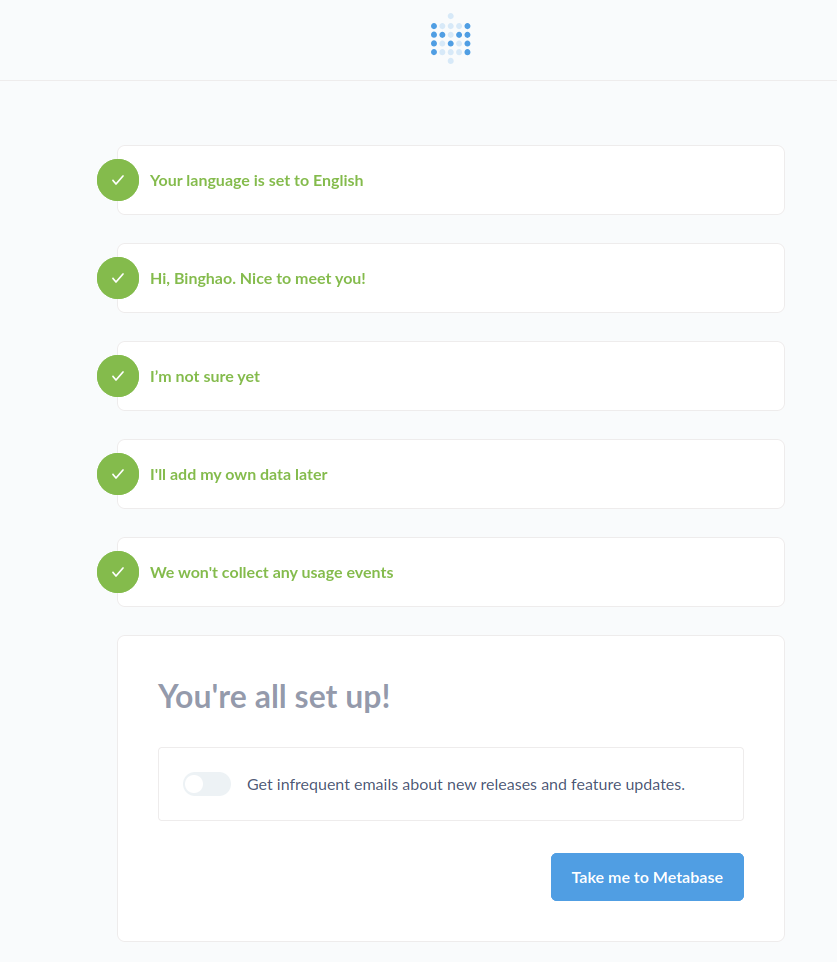
driver: bridge The first thing once you navigate to localhost:3000, you’ll be greeted with a user creation screen. Just enter the details as you see fit, hit “Take me to Metabase” and you’re in!
Connecting a database
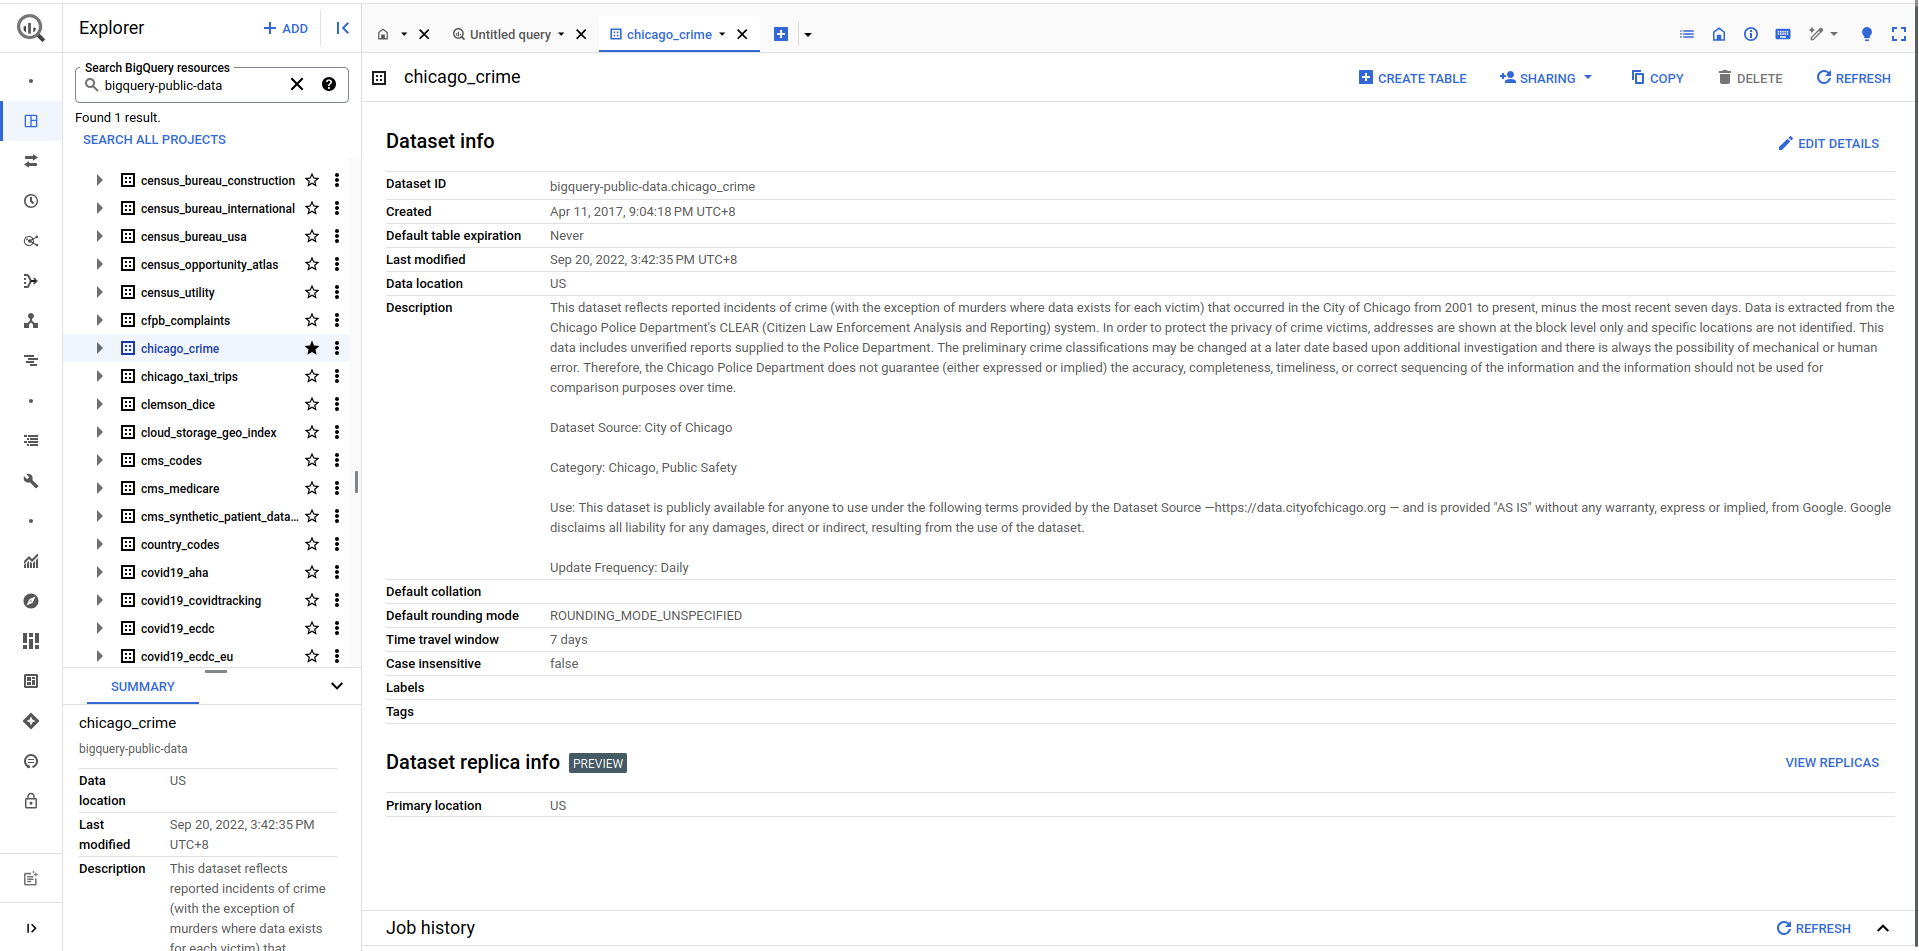
I decided I should try and connect a BiqQuery public dataset as my test data to test out how easy it is to connect to remote databases. For those of you who don’t know, Google BiqQuery hosts a series of public datasets for people to use.
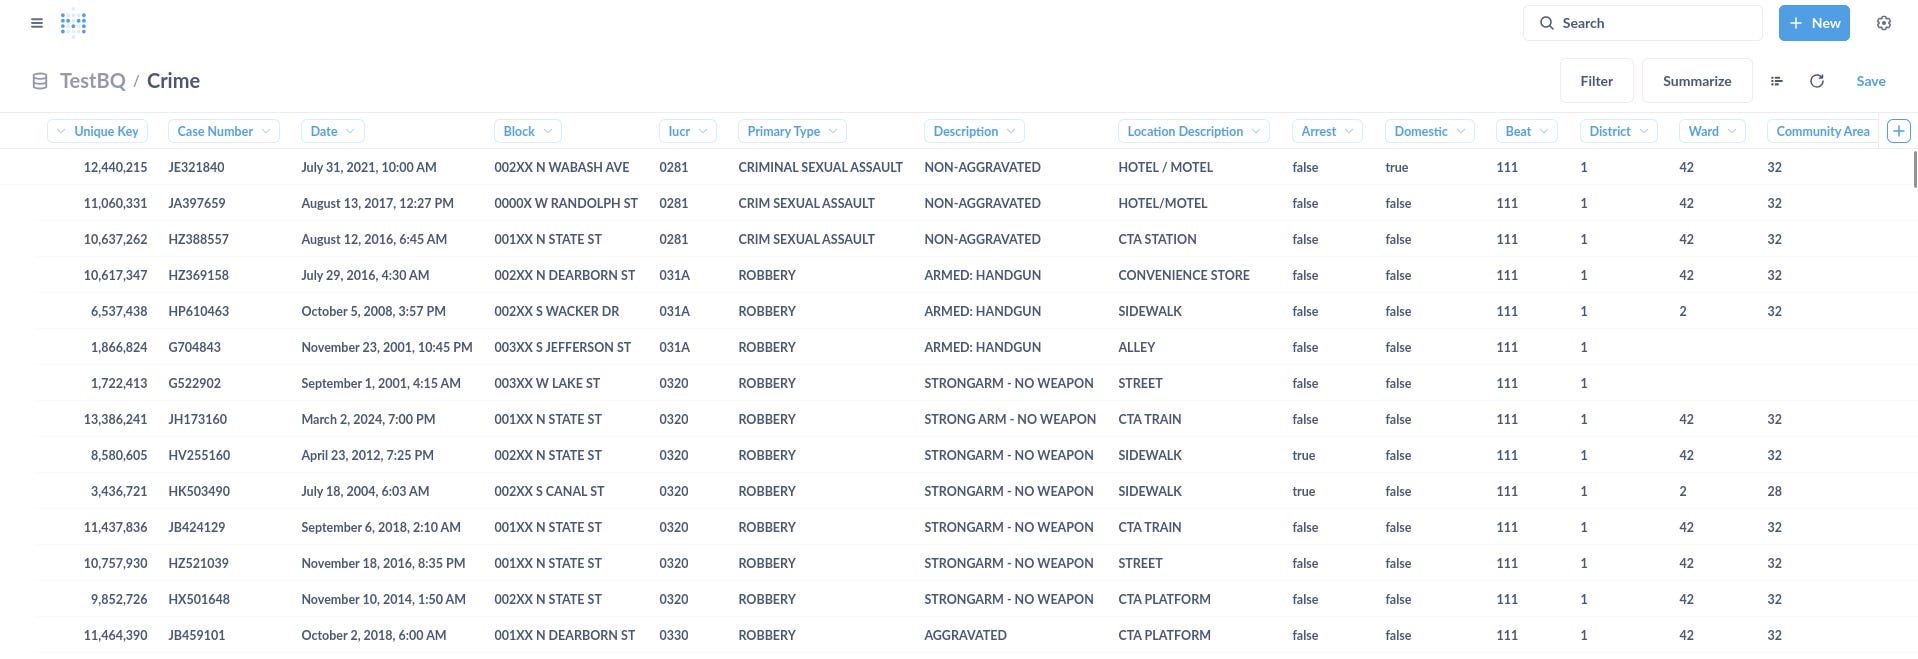
In this experiment, I chose to use the Chicago Crime dataset. I started by first copying the dataset into my own Google Cloud project. This is pretty simple. Navigate to the dataset and click “Copy” on the top right and enter the required details (you can even set the dataset to expire after a certain number days so that you don’t keep it in your project indefinitely).
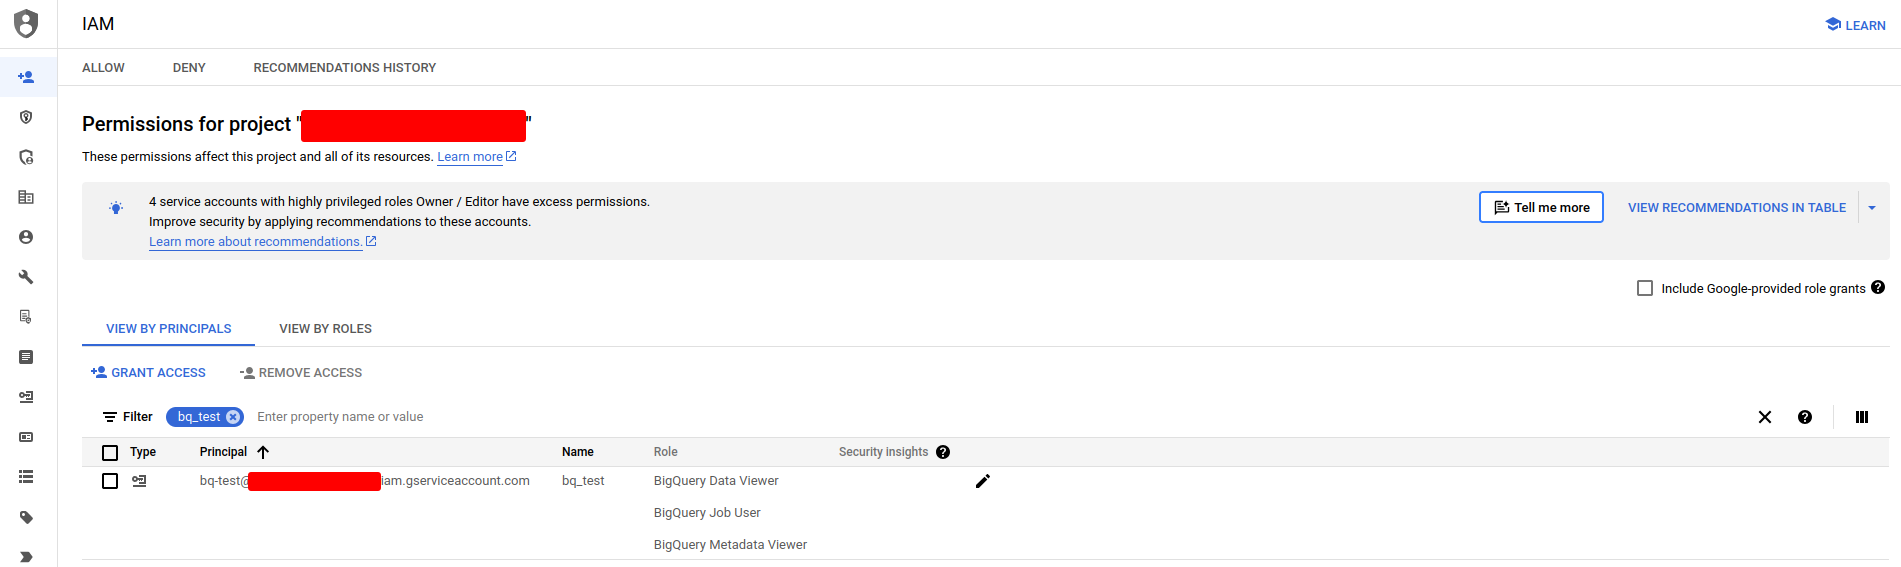
Next to allow metabase to reach the dataset in my Google Cloud project, I created a service account with the requisite privileges. See instructions here.
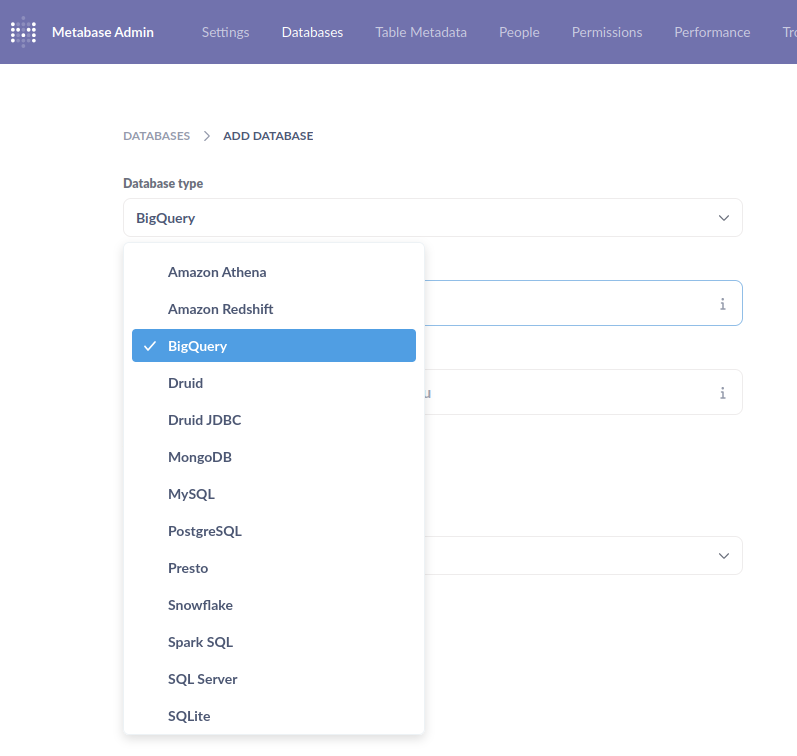
After which, I downloaded the JSON key for the service account and added it to Metabase in the “Add Database” page. As can be seen below, many other database connectors are available.
Once that was done, I was able to preview the data immediately. Tada!
Using Metabase
The overall experience was pretty much similar to that of Superset. Once you have your dataset ready and connected, you are able to filter and summarise via a drag-and-drop UI (seen below) or via SQL statements.
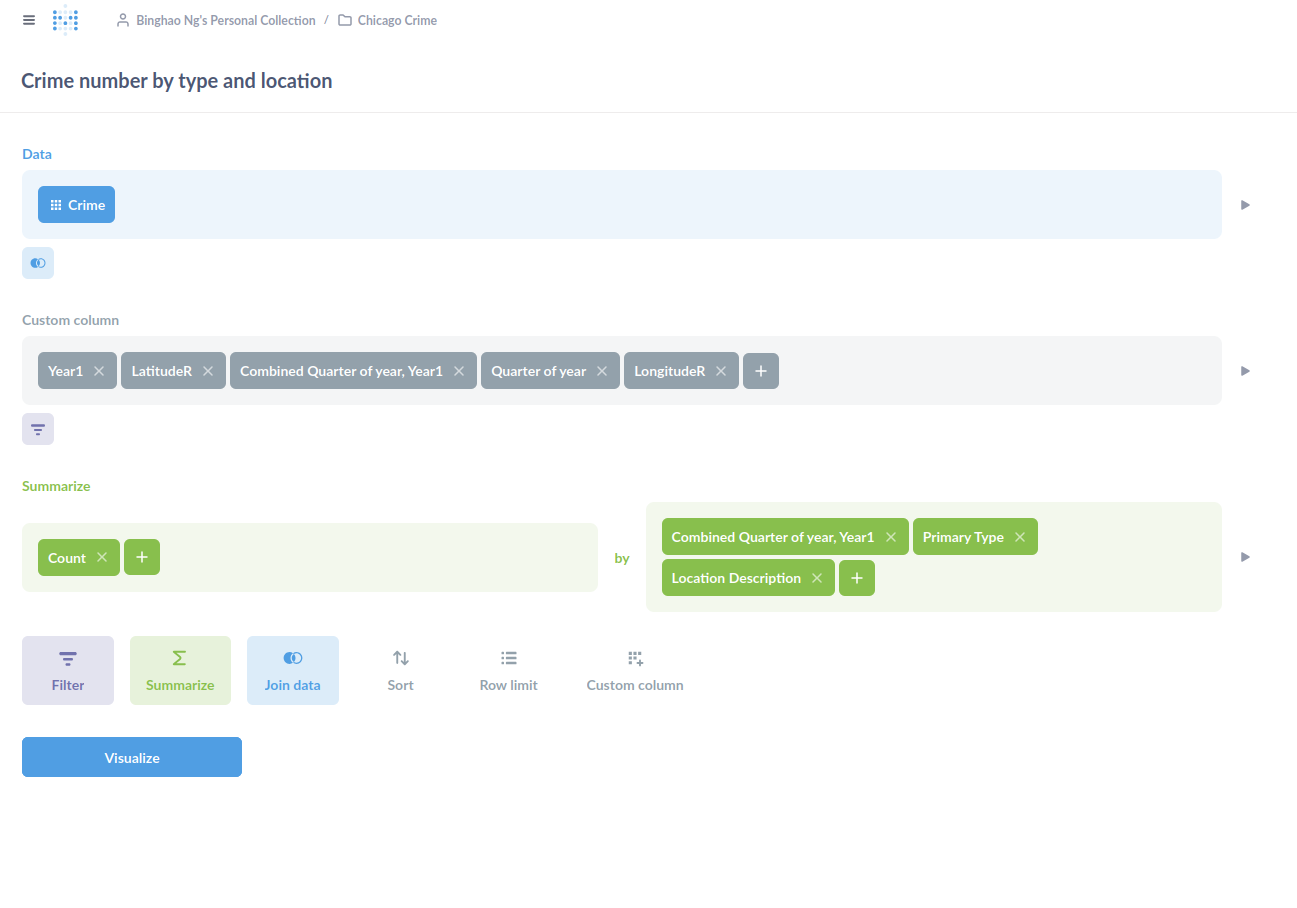
The thing I had to get used to was the idea of Questions and Models. Questions are basically your SQL statements. Each question is coupled with a visualisation, of which there are many to choose from. Models are like your database views. They too can have a visualisation coupled with it. The key difference between a question and a model, as far as I can tell, is that models allow other questions to be built on top of it, which makes sense.
There’s also the idea of Collections to group your questions and models. I guess, it’s to support different use cases on the same datasets.
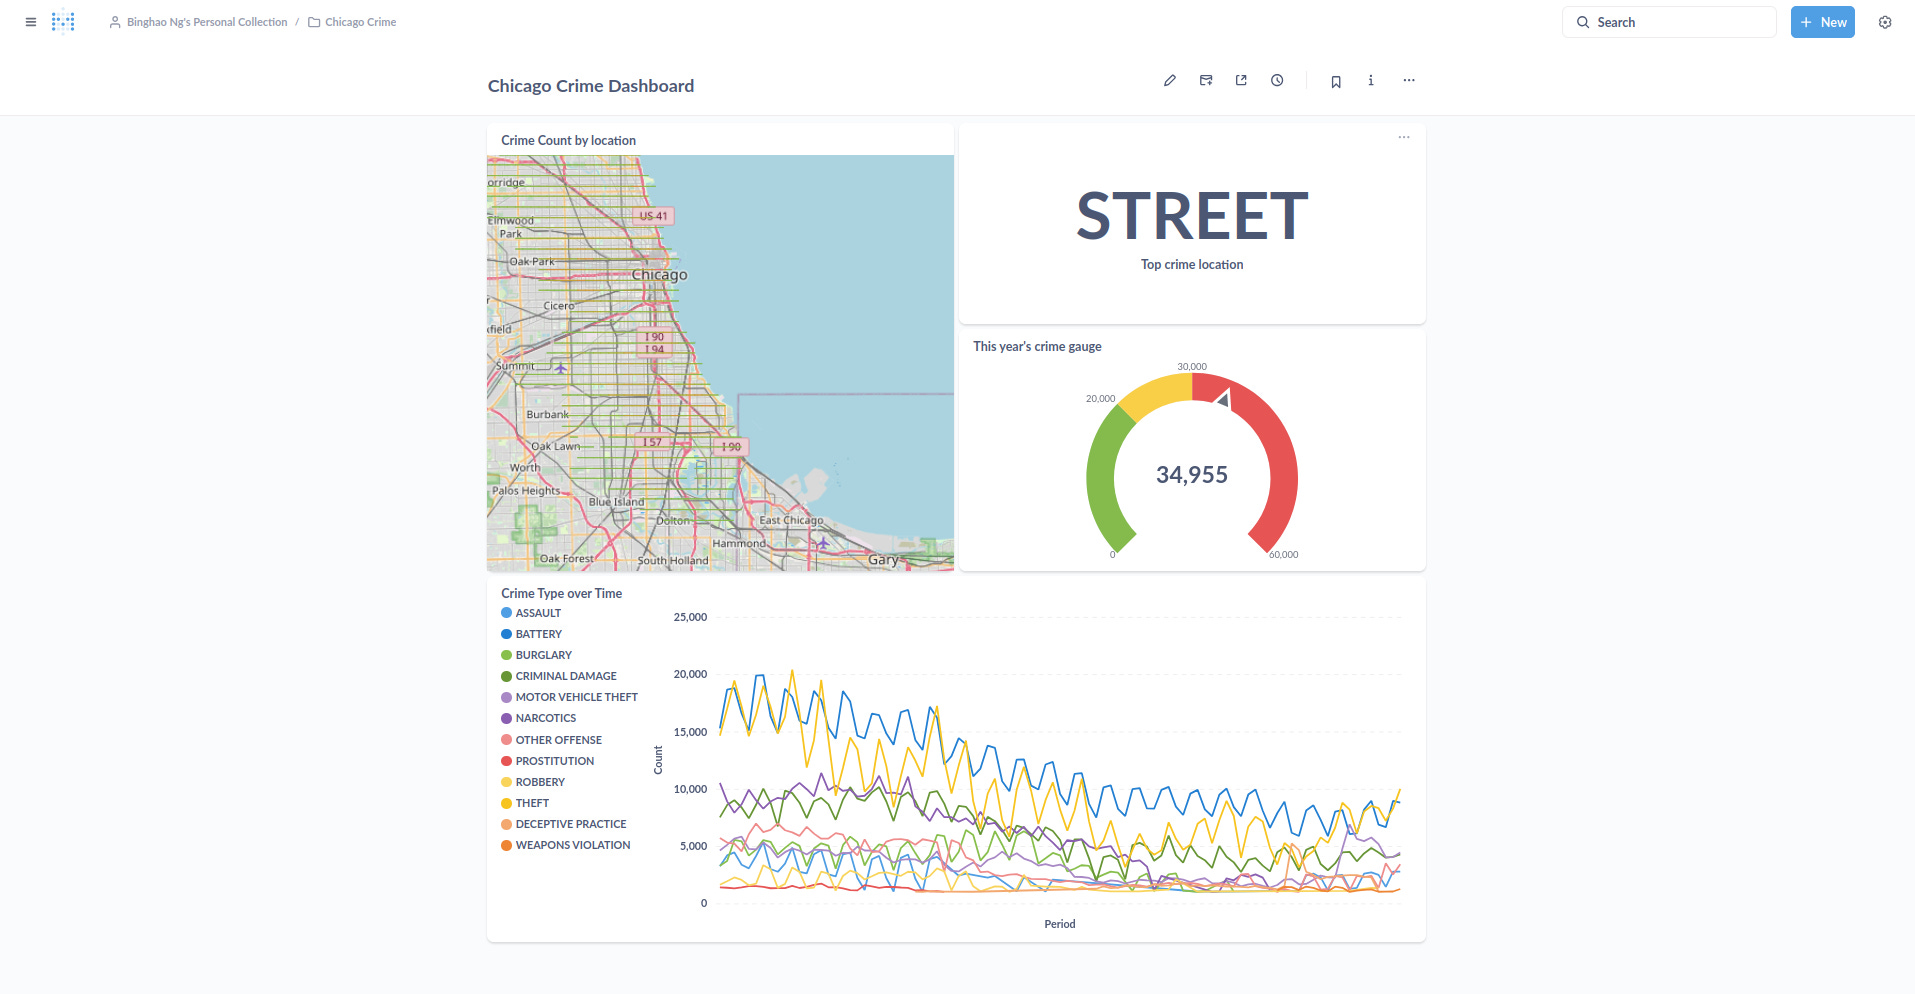
Once you have all the visualisations read, you can put them all in a dashboard like below.
There were also other features like updating the data sync frequency and allowing people to subscribe to dashboard changes that I didn’t try.
Final thoughts
On the whole, I thought the user experience was rather pleasant and somewhat similar to what you would get in Superset or PowerBI. There was not much to complain about. The data onboarding was uneventful. The data refresh was pretty snappy (of course, it depends on the network and infra conditions you have. BigQuery’s pretty quick for most things). The organisation of the entire app was rather logical once you understand its concepts of questions and models.
I can also see Metabase’s utility to non-technical users with some knowledge of data modelling and manipulation. You would still need to understand group by and all that but you don’t need to code.
Although like any other BI tool out there, once the team gets big and you start to have many datasets, effort needs to be put in to maintain organisation and ensure that performance does not degrade. Even in the simple experiment I did here, BigQuery was queried several times with each question formulation. I can only imagine what that would do to on-premise databases with multiple teams trying to get their questions answered.
As to how such a tool will fit into the “ChatGPT-everything” age, I still feel that having drag-and-drop filters help and can be more efficient than simply using Large Language Models (LLMs) to go from question to answer. This is because it can be hard to express things in our heads to an LLM, whereas having the right buttons to click allows us to quickly narrow down the search field. That being said, LLMs can perhaps play a role in correcting our SQL statements or helping us discover other datasets within the organisation.
Lastly, as I was using Metabase to generate the visualisations, I can’t help but feel a little frustrated at the visualisation controls. I felt that I could have done things a lot faster in Python. Perhaps this is due to my training as a data scientist. Perhaps I’m not the intended audience for Metabase. But I thought it’d be great if there’s a way for me to run Python-based queries and create graphs using matplotlib or plotly. In this way, I can do things quickly and yet use the other functions of Metabase like dashboards or notifications.